

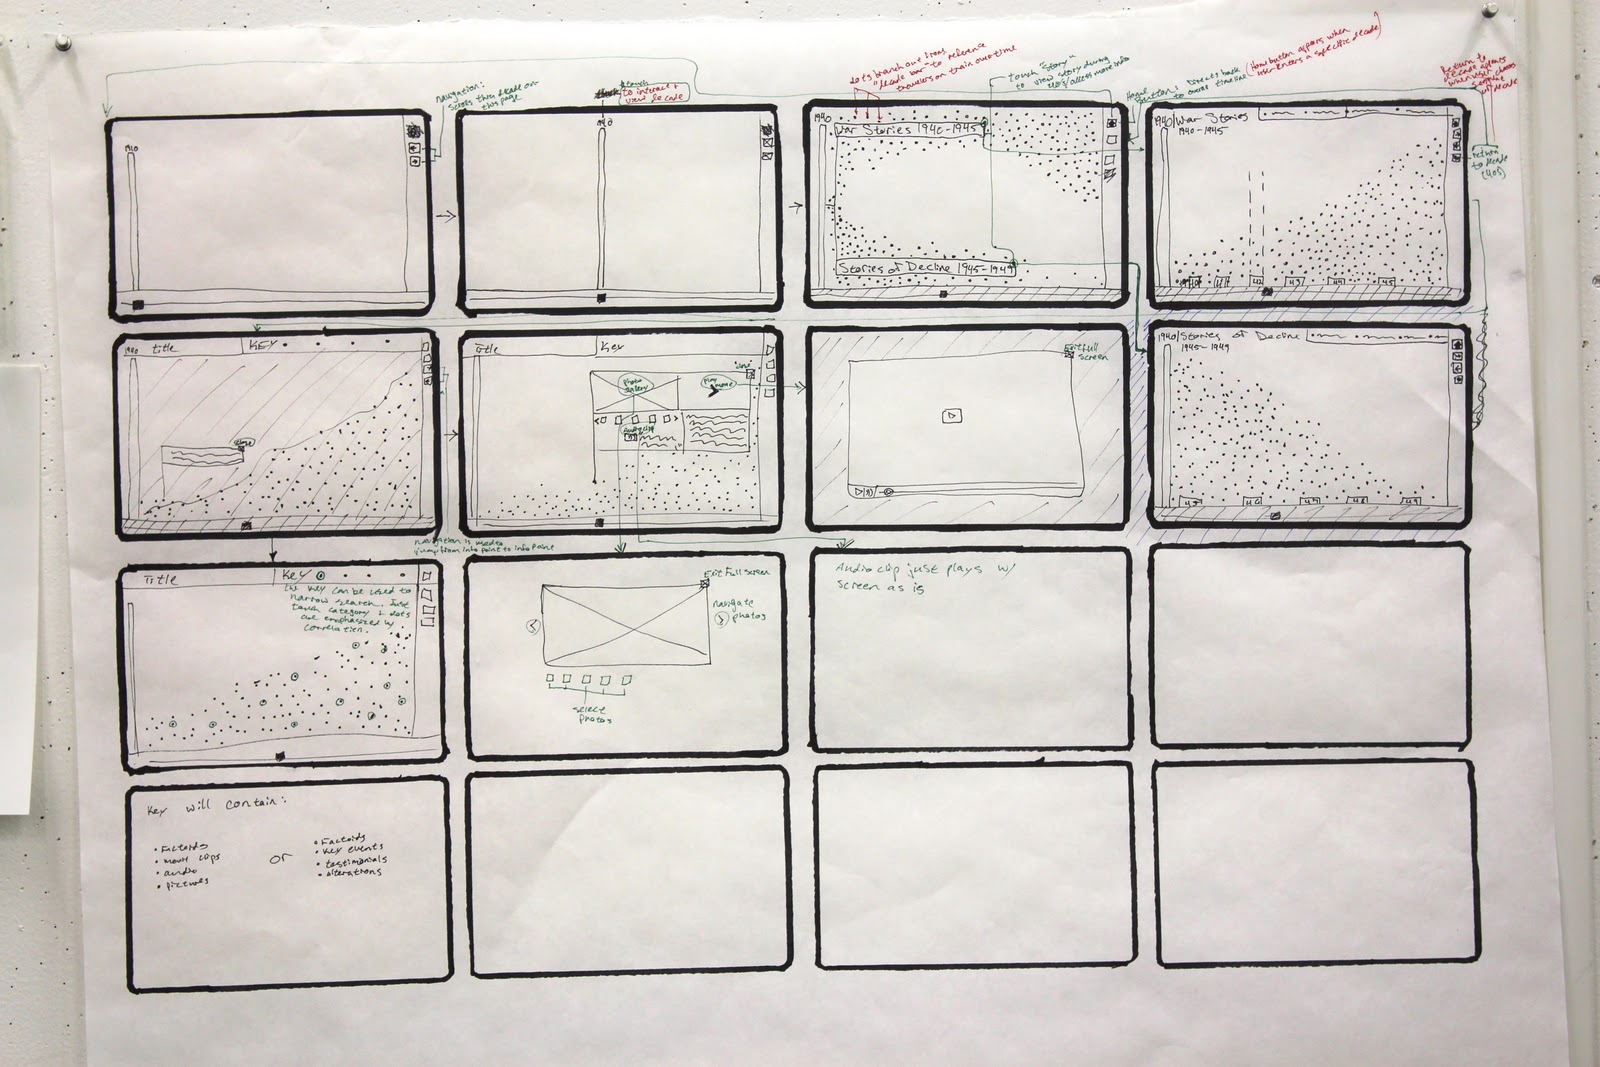
UI Concept #1
Interactive timeline with integrated audio, video, photograph, and testimonials. As you move through the timeline with your finger (swipe) you can scroll through the different years and events. Select an event and by the icon bellow you can tell what media it is. If that is what you want you can move forward with your selection. Photograph has an option slide show if there is more than one image with additional blurb or information. With the audio selection you have the standard audio controls layout. On the audio bar it would show you where you are so far into the audio clip. Buffer may or may not be shown. Maybe not if we don't want the viewer to think that there is a chance of it not buffering properly? Maybe it would be better if the audio was loaded to an SSD drive and then there wouldn't be any load time at all. With the video clip there is the standard video controls. In this case I only want to show pause, play, and the X for closing the box. At the bottom of the timeline there is a micro timeline view. If you select the small timeline it pops up showing a slide bar with each year of the decade its currently in and highlighting which one you're currently on. In the top right corner there is an icon for expand. When you select this icon is opens up the macro view. In the macro view you see each decade as a cropped sliver of an image that is highlighting one of the most important moments in that decade. They would function as a cycling / rotating view controlled with a swipe motion and tap to close. At the bottom of the page there is a check box for infographic view. With this selected as you move through the normal timeline each selection that you scroll through at the bottom of the page on top of the micro timeline bar an infographic highlight of that years tickets sold, and trains run through the station. The years prior and after the year selected are shown leading the viewer to continue on through the timeline as well as informing them of the rise and decline in an interesting visual graph.
UI Concept #2

No comments:
Post a Comment